Introduction
Dynamics CRM and now Dynamics 365 have always had analytical features enabling the users or administrators to create visualizations of their data to gain better insights on business data. For a while, the main go to options have been the built-in charts and dashboards, SSRS reporting and of course Excel. However, more and more options and features for analyzing data are starting to appear. Some years ago, the Excel add-ins PowerQuery and PowerPivot started adding more options, and now the Power BI Desktop application and PowerBI.com have extensive analytical and reporting capabilities on the Dynamics 365 data. Power BI dashboards and Power BI tiles can even be integrated in to Dynamics 365.
With the latest release of Dynamics 365 comes a new option called Customer Insights. Microsoft has shown some demos of this very powerful analytical tool and how it can create KPIs on customer data and show the KPIs specific to the customer record that you are looking at, something that Power BI specifically cannot do. Customer Insights drives the Relationship Analytics capabilities that were previewed during the recent announcements of Dynamics 365, giving users visual insight into the relationship health of an opportunity, all based on related activities and recency.
Each of the different options: Power BI, Customer Insights, and Charts and Dashboards have their target purposes as well as pros and cons. We will try give you an overview of the different options and the areas that are worth considering when using them with Dynamics 365.
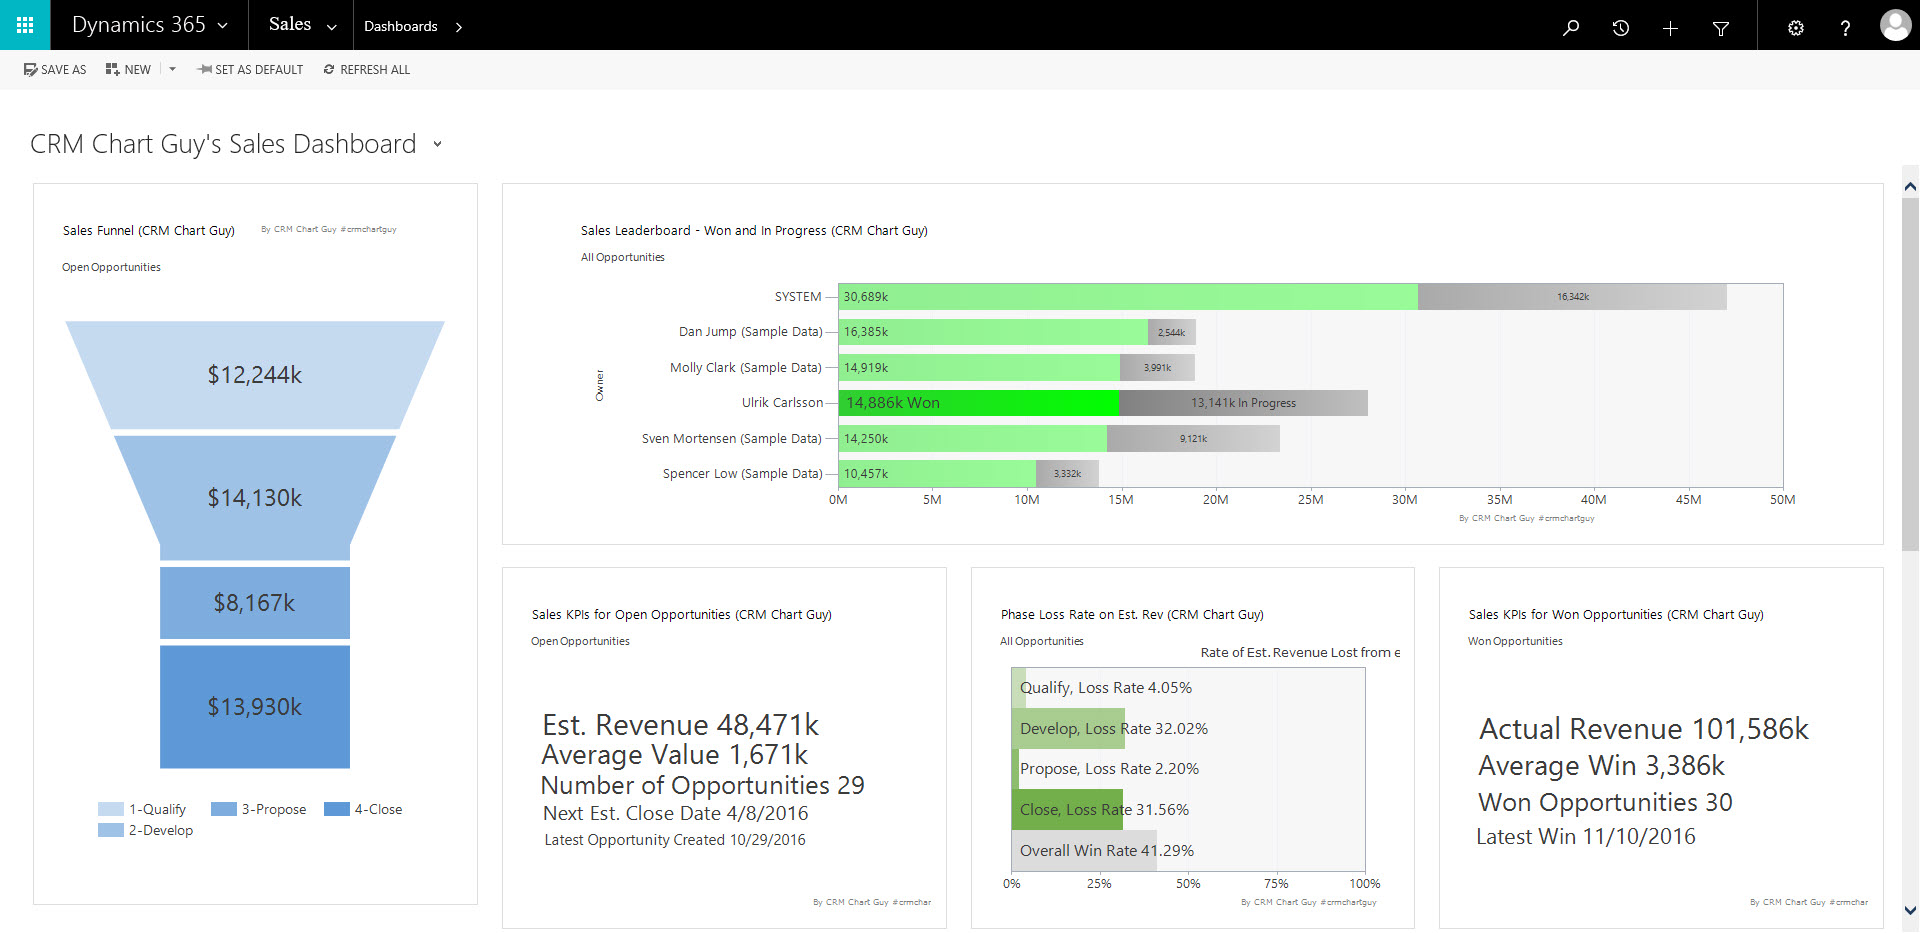
Standard Sales dashboard displayed in Dynamics 365
Power BI
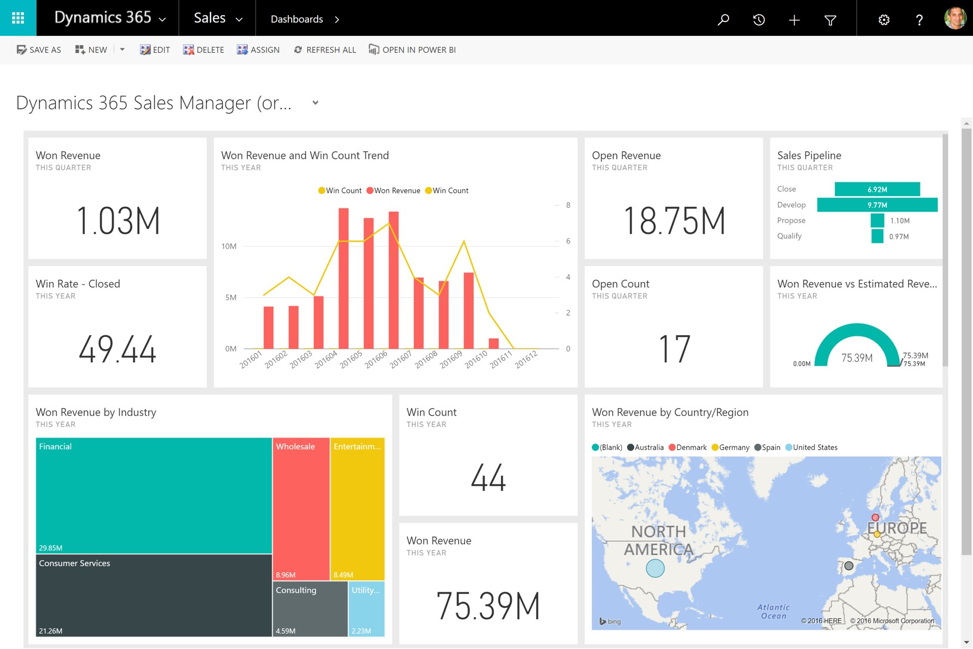
Power BI dashboard displayed within Dynamics 365
Power BI has proven to be a robust analytical tool that is being updated at breakneck speed. Significant feature improvements are literally coming to the desktop application monthly. It excels in modeling data and combining data from multiple sources and joining them in to one comprehensive report.
The “integrations” with Dynamics 365 have gotten tighter and you can now display full Power BI dashboards within Dynamics 365 and add individual Power BI tiles on user created dashboards.
While featuring powerful drill-down features on the data in the visualizations, there is no direct record access from the Power BI components. i.e. you can’t drill down to a case and then click the case to work on it.
Power BI’s connection to Dynamics 365 respects the security privileges of the user creating the report. That user can then share the report with other users, even if those users do not have access privileges to the data used. Reports then can be shared with the only the appropriate individuals. Power BI Pro does offer extra features for RLS (Row Level Security), so some security can be imposed on the data within the reports. However, RLS is managed separately in Power BI Pro and is not integrated or synchronized with Security Roles in Dynamics 365.
Power BI’s main role is as an executive reporting tool, giving significant insights on all the business’ data sources.
Customer Insights
Customer Insights, and its more advertised sub-feature Relationship Analytics, is an Azure based analytical solution. In Customer Insights, administrators can create KPI’s and insight panels for various customer profiles. The concept is that the Customer Insight charts and KPIs, as well as Relationship Analytics, is viewed in context of a specific profile. That profile can be a Contact, Account, Lead, Opportunity or another custom entity.
The Customer Insights hub is set up and managed in Azure and can pull data from Dynamics 365 or Azure Blob Storage. More options for sources will be added in coming releases. The data and the KPIs is then updated every 15 minutes.
These Azure Customer Insight components can also be added to the forms in Dynamics 365, giving you KPIs in context of the customer.
As Customer Insights resides in Azure, a subscription is required and the Customer Insights does come at an additional cost. At the time of writing, the cost USD 250.00 per month for up to 1 million interactions and 100,000 profiles.
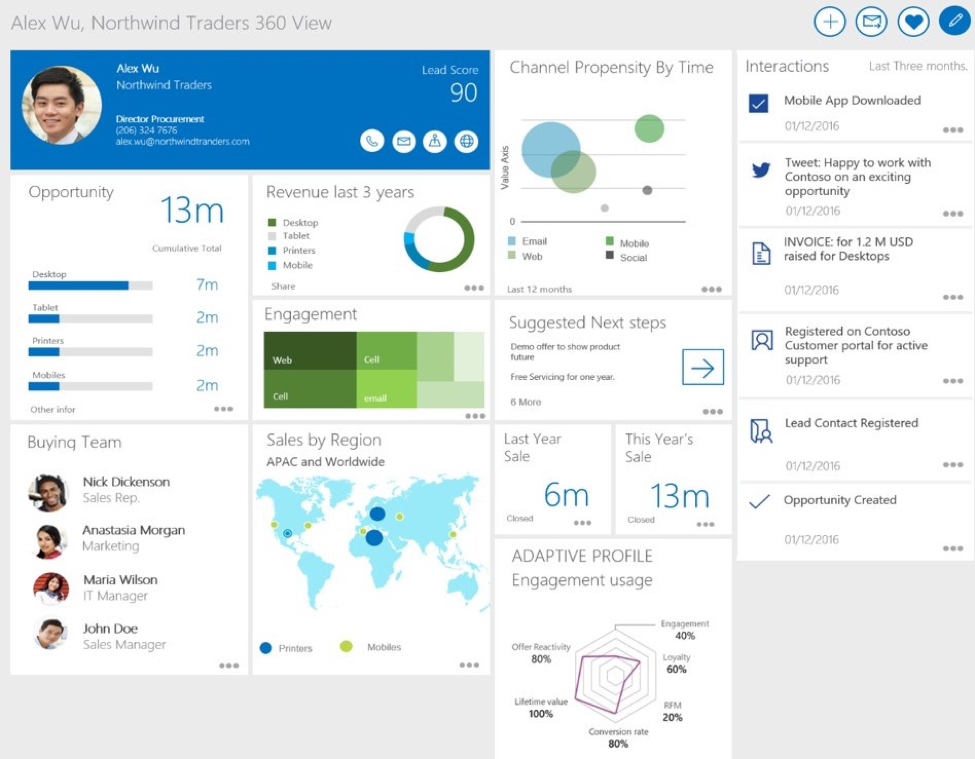
Customer Insights panel shown on the Customer Insights application
Charts and Dashboards
Last, but certainly not least, charts and dashboards are still available in Dynamics 365 for real-time ad-hoc reporting and dashboard creation at the user level. Outside of a few minor bug fixes, the charting features have not really been updated at all in the past few years. This is of course unfortunate as it is a very powerful analytical tool. Users can also edit the chart xml to achieve more advanced KPIs than they can with the built-in chart editor. However, charts are limited at 50,000 records and queries are also somewhat limited by the capabilities of the fetchXML. Charts are also limited to only access data within Dynamics 365. Outside of the most standard count, sum, average, and min/max calculations, charts tend to come up short and will likely need to take advantage of calculated fields or roll-up fields in Dynamics 365 to do more complex analytics. This is something that Power BI can do without having to make changes to the data structure, although charts also covers the most common options.
Charts still have some big advantages over the other analytical options. Specifically, they are real-time and offer drill-down capabilities with direct access to the underlying records. In service management where meeting tight SLA requirements is a necessity, the ability to click through a chart to the most relevant cases and then directly work on it from there is a major advantage. Since charts are using fecthXML, or “Views” in Dynamics 356, the data is also contextual to the user that is logged in, showing them only the data needed at a given time. You can also add charts to forms, for contextual analytics relevant to the record you are viewing. This is like Customer Insights, but without the need for an Azure subscription.
Comparison Overview
The CRM Chart Guy has created this helpful matrix to give an overview of some of the features and benefits of each solution:
| Feature | Power BI | Power BI Pro | Customer Insights | Charts |
| Contextual to Record/Add to Form | No | No | Yes | Yes |
| Data Contextual to logged in User | No | No | No | Yes |
| Drill Down | Yes, but no access to CRM records | Yes, but no access to CRM records | Yes, but no access to CRM records | Yes – with access to CRM records |
| Geo-Coded Data/Maps | Yes | Yes | Yes | No |
| User Sharing of Content | Yes, through Power BI*1 | Yes, through Power BI*1 | No | Yes, in CRM |
| Azure Required | No | No | Yes | No |
| Respects CRM Security Roles | No | No, but have RLS – Row Level Security *2 | No, managed through Roles in the Customer Insights hub on Azure | Yes |
| Data Refresh | Daily | Hourly (up 8 times a day) | 15 minutes*3 | LIVE |
| External Data | Yes | Yes | Yes*4 | No |
| Record/Size Limit | 1GB per User | 10GB per User | Depends on subscription (see cost) | 50k records |
| Admin or User setup | User | User | Admin | User or Admin |
| Cost | Free | USD 9.99/month/user | USD 250.00 per month for up to 1 mil interactions and 100k profiles | Free |
*1 Sharing Power BI reports and dashboards happens through Power BI. If adding Power BI tiles to a User dashboard in Dynamics 365, both the Dynamics 365 dashboard and the Power BI dashboard must be shared with the other Users. Power BI Tiles and Power BI Dashboards cannot be included in System Dashboards in Dynamics 365.
*2 All security is handled through Power BI. A user can grant another user access to reports containing data the recipients do not have access to in Dynamics 365. RLS, Row Level Security, is for Power BI Pro only and is managed separately in Power BI.
*3 Azure Customer Insights hub imports a delta every 15 minutes and recalculates the KPIs and visualizations.
*4 Azure Customer Insights hub currently only supports Dynamics 365 and Azure Blob Storage. More data sources will be added later.
How to Choose?
Between Power BI, Customer Insights and the built-in charting engine, Dynamics 365 offers some wildly powerful analytical options, each with their own set of advantages. Which one should be your go-to analytical tool depends on your business requirements and in which context the information will be consumed. They are all separate tools and there is no reason you cannot or should not take advantage of all three at the same time.
It may also be as simple as what you have access to. Customer Insights has the highest learning curve of the three options and requires you to set up and pay for an Azure service as well. Power BI, with the free version being available to most users still requires some setup and training would be recommended if you want to take full advantage of the features.
Charts are accessible to all users and everyone can save and share their own charts with other users or teams. Users can even export the chart xml, make modifications and import them back in to the system without needing a System Administrator. Of course, modifying the chart xml may not be for everyone, but plenty of step by step instructions can be found at www.crmchartguy.wordpress.com
Analytic options for Dynamics 365 are evolving and the options described above change with every release. For the time, it seems clear that Microsoft is putting the development resources into analytical tools outside of Dynamics 365. Both Power BI and Customer Insights work by taking the data out of Dynamics 365, manipulate it, generate the reports and then display it back either inside or outside of Dynamics 365. The charts that work entirely within Dynamics 365 have not been updated for a long time. This is unfortunate, as the .Net based charts have many more options and features than the chart editor gives you. Minor updates in this area could have significant leaps in the feature set. Although, it does make sense for Microsoft to invest in tools and solutions that work across multiple LOB applications, rather than just within Dynamics 365.
Are you ready to see where digital transformation with Dynamics 365 can take you? Contact us today to find out.